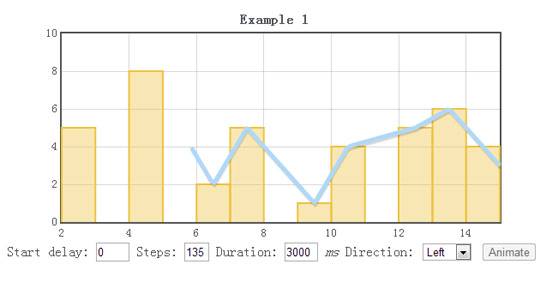
动画统计,包括曲线,柱状图等

XML/HTML Code
- <table style="margin-left:auto;margin-right:auto;">
- <tr>
- <td style="text-align:center;"><h3 style="margin-bottom:0px;">Example 1</h3>
- <div id="chart1" style="width:540px;height:250px;padding:5px;"></div>
- <div style="text-align:right;padding-right:5px;"> Start delay:
- <input id="start" style="width:35px" value="0" />
- Steps:
- <input id="steps" style="width:25px" value="135" />
- Duration:
- <input id="duration" style="width:35px" value="3000" />
- <i>ms</i> Direction:
- <select id="dir">
- <option value="right">Right</option>
- <option value="left" selected>Left</option>
- </select>
- <button id="bnt1" type="button">Animate</button>
- </div></td>
- </tr>
- <tr>
- <td style="text-align:center;"><h3 style="margin-bottom:0px;">Example 2</h3>
- <div id="chart2" style="width:540px;height:250px;padding:5px;"></div>
- <button id="bnt2" type="button">Animate</button></td>
- </tr>
- <tr>
- <td style="text-align:center;"><h3 style="margin-bottom:0px;">Example 3</h3>
- <div id="chart3" style="width:540px;height:250px;padding:5px;"></div>
- <button id="bnt3" type="button">Animate</button></td>
- </tr>
- <tr>
- <td style="text-align:center;"><h3 style="margin-bottom:0px;">Example 4</h3>
- <div id="chart4" style="width:540px;height:250px;padding:5px;"></div>
- <button id="bnt4" type="button">Animate</button></td>
- </tr>
- </table>
JavaScript Code
- <script type="text/javascript">
- $(window).load(function () {
- var d8 = [[2, 5],[4, 8],[6, 2],[7, 5],[9,1],[10, 4],[12, 5],[13, 6],[14, 4]];
- var d9 = [[2, 4],[2.5, 5],[4.5, 8],[6.5, 2],[7.5, 5],[9.5,1],[10.5, 4],[12.5, 5],[13.5, 6],[14.5, 4],[15, 3]];
- var plot1 = $.plotAnimator($("#chart1"), [{data : d8, bars: { show: true, fill: true}},{data : d9, lines: {lineWidth:5}, animator: {start:$("#start").val(), steps:$("#steps").val(), duration:$("#duration").val(), direction: $("#dir").val()}}]);
- $("#bnt1").attr("disabled", "disabled");
- $("#chart1").on("animatorComplete", function() {
- $("#bnt1").removeAttr("disabled")
- });
- $("#bnt1").on("click",function() {
- $("#bnt1").attr("disabled", "disabled");
- plot1 = $.plotAnimator($("#chart1"), [{data : d8, bars: { show: true, fill: true}},{data : d9, lines: {lineWidth:5}, animator: {start:$("#start").val(), steps:$("#steps").val(), duration:$("#duration").val(), direction: $("#dir").val()}}]);
- });
- var d0 = [[2, 5], [4, 8], [6, 2], [7, 3], [10, 4], [12, 5], [13, 6], [14, 4]];
- var plot2 = $.plotAnimator($("#chart2"), [{ data: d0, animator: {steps: 136, duration: 2500, start:0}, lines: { show: true, fill: false },label: "Let's Go" }],{grid: { backgroundColor: { colors: [ "#fff", "#eee" ] }}});
- $("#bnt2").attr("disabled", "disabled");
- $("#chart2").on("animatorComplete", function() {
- $("#bnt2").removeAttr("disabled")
- });
- $("#bnt2").on("click",function() {
- $("#bnt2").attr("disabled", "disabled");
- plot2 = $.plotAnimator($("#chart2"), [{ data: d0, animator: {steps: 136, duration: 2500, start:0}, lines: { show: true, fill: false },label: "Let's Go" }],{grid: { backgroundColor: { colors: [ "#fff", "#eee" ] }}});
- });
- var d5 = [[1, 4], [2, 2], [4, 4], [6, 2], [8, 4], [10, 2], [15, 4], [20, 2]];
- var d6 = [[1, 3], [20, 3]];
- var plot3 = $.plotAnimator($("#chart3"), [{ data: d5, animator: {steps: 136, duration: 2000, start:0}, lines: { show: true, fill: true }, label: "Fill this"}, { data: d6, lines: { show: true, fill: false}, label: "Standard Values" }],{grid: { backgroundColor: { colors: [ "#fff", "#ebe" ] }}});
- $("#bnt3").attr("disabled", "disabled");
- $("#chart3").on("animatorComplete", function() {
- $("#bnt3").removeAttr("disabled")
- });
- $("#bnt3").on("click",function() {
- $("#bnt3").attr("disabled", "disabled");
- plot3 = $.plotAnimator($("#chart3"), [{ data: d5, animator: {steps: 136, duration: 2000, start:0}, lines: { show: true, fill: true }, label: "Fill this"}, { data: d6, lines: { show: true, fill: false}, label: "Standard Values" }],{grid: { backgroundColor: { colors: [ "#fff", "#ebe" ] }}});
- });
- var d2 = [];
- for (var i = 0 ; i < 20.1 ; i += 0.1) d2.push([i, Math.sin(i)]);
- var d3 = [[0, 0], [20, 0]];
- var plot4 = $.plotAnimator($("#chart4"), [{ data: d2, animator: {steps: 136, duration: 3000, start:0}, lines: { show: true, fill: true }, label: "sin(x)" }, { data: d3, lines: { show: true, fill: false } }, { data: d2, lines: { show: true, fill: false } }],{grid: { backgroundColor: { colors: [ "#fff", "#eee" ] }}});
- $("#bnt4").attr("disabled", "disabled");
- $("#chart4").on("animatorComplete", function() {
- $("#bnt4").removeAttr("disabled")
- });
- $("#bnt4").on("click",function() {
- $("#bnt4").attr("disabled", "disabled");
- plot4 = $.plotAnimator($("#chart4"), [{ data: d2, animator: {steps: 136, duration: 3000, start:0}, lines: { show: true, fill: true }, label: "sin(x)" }, { data: d3, lines: { show: true, fill: false } }, { data: d2, lines: { show: true, fill: false } }],{grid: { backgroundColor: { colors: [ "#fff", "#eee" ] }}});
- });
- });
- </script>


相关推荐
xml灵活配置 flash统计图- flash柱形图- flash圆饼图- flash折线图 多款flash统计图动画
内容索引:脚本资源,jQuery,highcharts,Js图表 jQuery highcharts 动感统计曲线图生成插件,它能以动画形式生成曲线图、柱状图、饼图等许多统计图形,还有一些更复杂的图形highcharts也能帮你完成,确实挺不错的,...
使用动画效果实现饼状图、柱状图、曲线图等统计报表,非常实用。
案例8 柱状图表分析图 案例9 柱状图表的升序和降序 案例10 折线图表分析图 案例11 多折线图表分析图 案例12 饼形图表分析图 本章小结 第6章 Visual C#2008的打印与水晶报表技朮 案例1 利用Windows组件打印...
案例8 柱状图表分析图 案例9 柱状图表的升序和降序 案例10 折线图表分析图 案例11 多折线图表分析图 案例12 饼形图表分析图 本章小结 第6章 Visualc#2008的打印与水晶报表技术 案例1 利用Windows组件打印数据库中的...
案例8 柱状图表分析图 案例9 柱状图表的升序和降序 案例10 折线图表分析图 案例11 多折线图表分析图 案例12 饼形图表分析图 本章小结 第6章 Visualc#2008的打印与水晶报表技术 案例1 利用Windows组件打印数据库中的...
案例8 柱状图表分析图 案例9 柱状图表的升序和降序 案例10 折线图表分析图 案例11 多折线图表分析图 案例12 饼形图表分析图 本章小结 第6章 Visualc#2008的打印与水晶报表技术 案例1 利用Windows组件打印数据库中的...
服务器可以将收集到的信息以柱状图和文件列表以及其他方式呈现给用户,以便用户对局域网内的主机进行监测和管理。 CClockST_demo 电子钟的实现,自绘Button、Static的实现,其中自定了一个辅助主题风格类。 ...
服务器可以将收集到的信息以柱状图和文件列表以及其他方式呈现给用户,以便用户对局域网内的主机进行监测和管理。 CClockST_demo 电子钟的实现,自绘Button、Static的实现,其中自定了一个辅助主题风格类。 ...
服务器可以将收集到的信息以柱状图和文件列表以及其他方式呈现给用户,以便用户对局域网内的主机进行监测和管理。 CClockST_demo 电子钟的实现,自绘Button、Static的实现,其中自定了一个辅助主题风格类。 ...
服务器可以将收集到的信息以柱状图和文件列表以及其他方式呈现给用户,以便用户对局域网内的主机进行监测和管理。 CClockST_demo 电子钟的实现,自绘Button、Static的实现,其中自定了一个辅助主题风格类。 ...
服务器可以将收集到的信息以柱状图和文件列表以及其他方式呈现给用户,以便用户对局域网内的主机进行监测和管理。 CClockST_demo 电子钟的实现,自绘Button、Static的实现,其中自定了一个辅助主题风格类。 ...
服务器可以将收集到的信息以柱状图和文件列表以及其他方式呈现给用户,以便用户对局域网内的主机进行监测和管理。 CClockST_demo 电子钟的实现,自绘Button、Static的实现,其中自定了一个辅助主题风格类。 ...
3.3.1 B 样条曲线插值..........................88 3.3.2 外推和 Spline 拟合.....................90 3.3.3 二维插值.....................................91 3.4 数值积分——integrate .................. 93 ...